USD/JPY
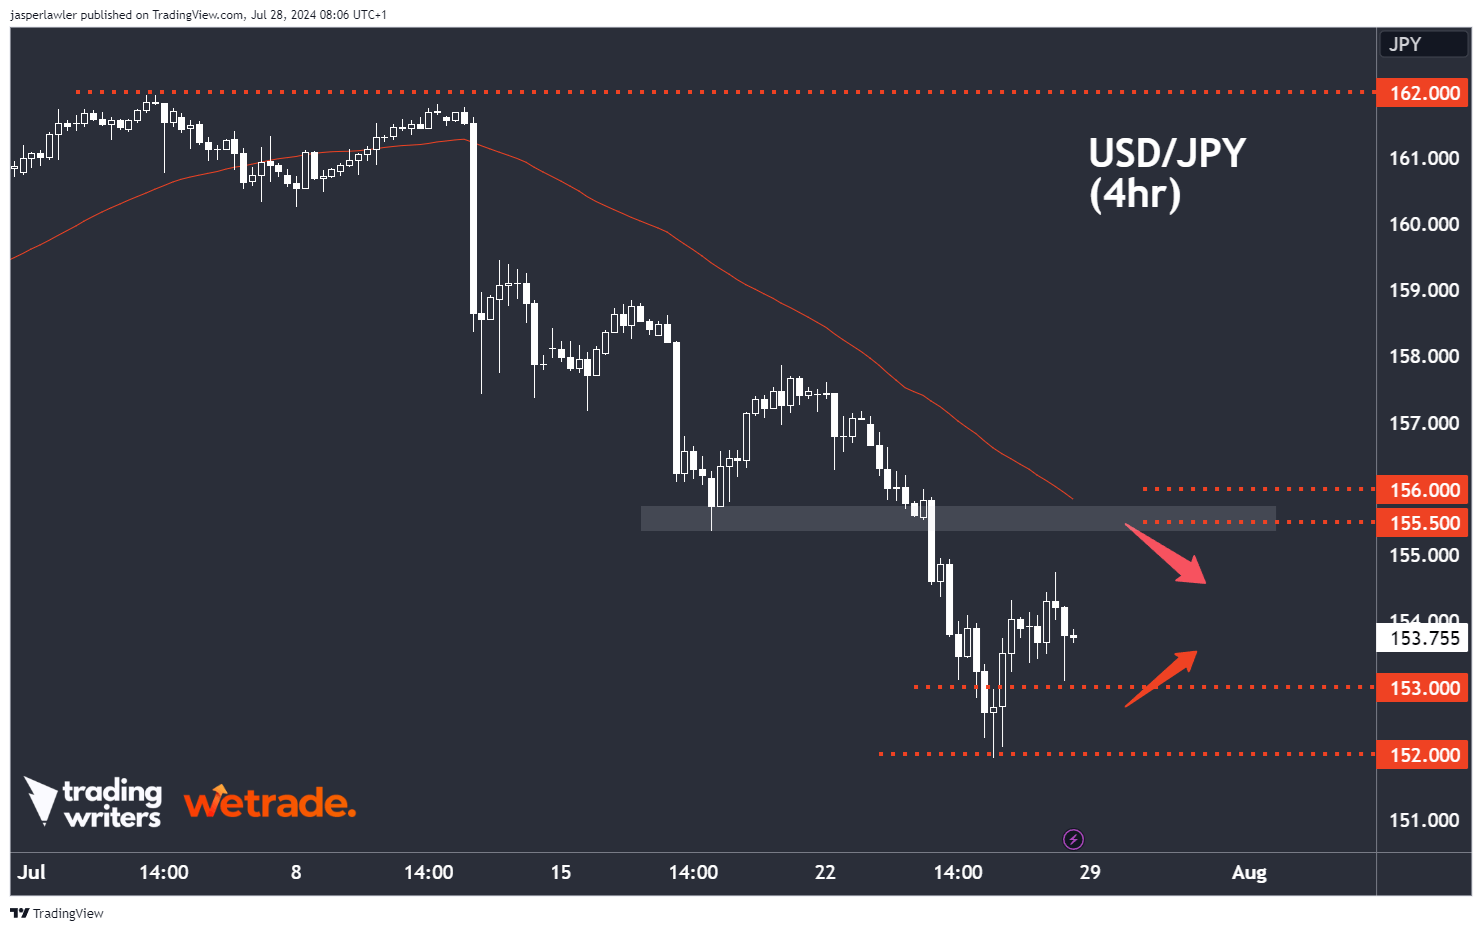
They say buy low and sell high - so naturally we’re watching USD/JPY which recently just went lower - A LOT lower. 1000 pips to be precise - from 162 all the way down to 152 in less than a month.
Usually though, there’s a good reason for the price to fall - and downtrends can last a lot longer than people can imagine.
That’s why if there is a rebound back to a confluence of the previous swing low and the 50 SMA around 155.5 - 156 we’ll be looking for another drop in the price back towards the low at 152.
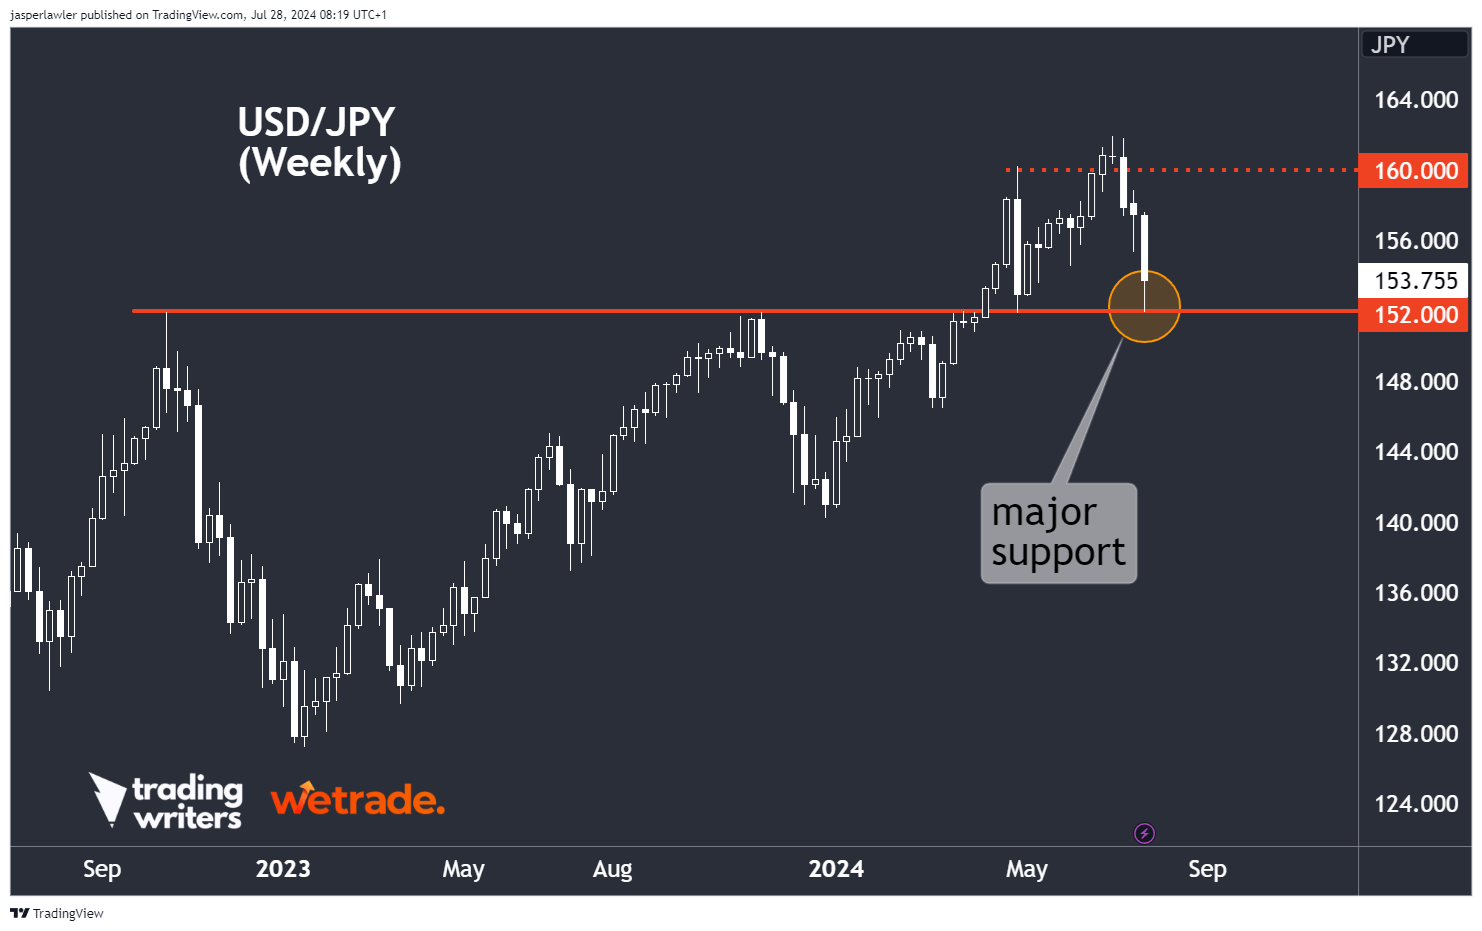
We follow trends and don’t usually try to pick bottoms or tops - the exception is when there is something ‘major’ happening on a higher timeframe.
In the case of USD/JPY there is major support coming in at 152 marked by the peaks in 2022 and 2023. It is also where the price stopped when it last retreated from the big 160 round number.
There has already been a 300 pip reaction off this level, which might be all there is before the price breaks down below 152. However, we will look for any pullback between 152 to 153 as a lower risk area to ride any further rebound from this major support - targeting the same 155.5-156 area.
EUR/USD
There are a lot of forex traders that trade only EUR/USD - and usually they are scalping or very short term so it's ok. Frankly, for swing traders, there are better places out there to be trading than EUR/USD right now.
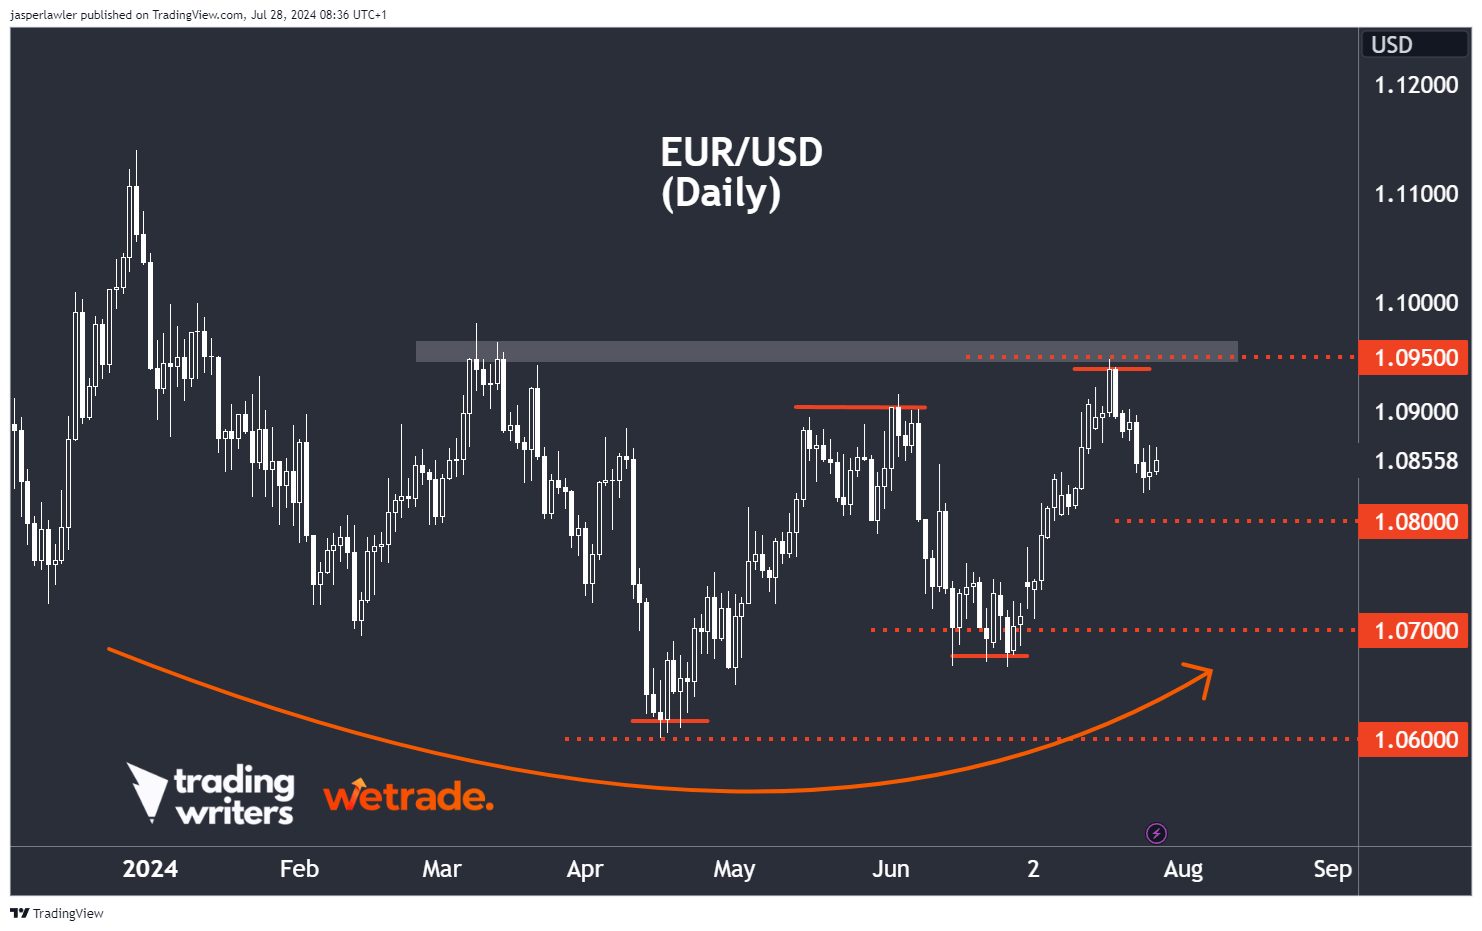
That would all change with a breakout over 1.095-1.10 but until then we are technically still in a sideways range on the daily chart. However, the last two major swing points were a higher low and higher high - suggesting the break is coming - just not yet.
For those looking to get ahead of the potential breakout scenario, the idea would be to pick the next swing low within the trading range.
If you think of this chart from the perspective of large speculators - it appears they first started buying in a 1.06 then the price rose and the got less interested and stopped buying - as the price dropped again, they started buying higher this time at 1.07 the price went up again - touched resistance at 1.095 and so the question is where they start buying in this time. If it follows the pattern of 100 pip increments - then the next low should come in at 1.08.
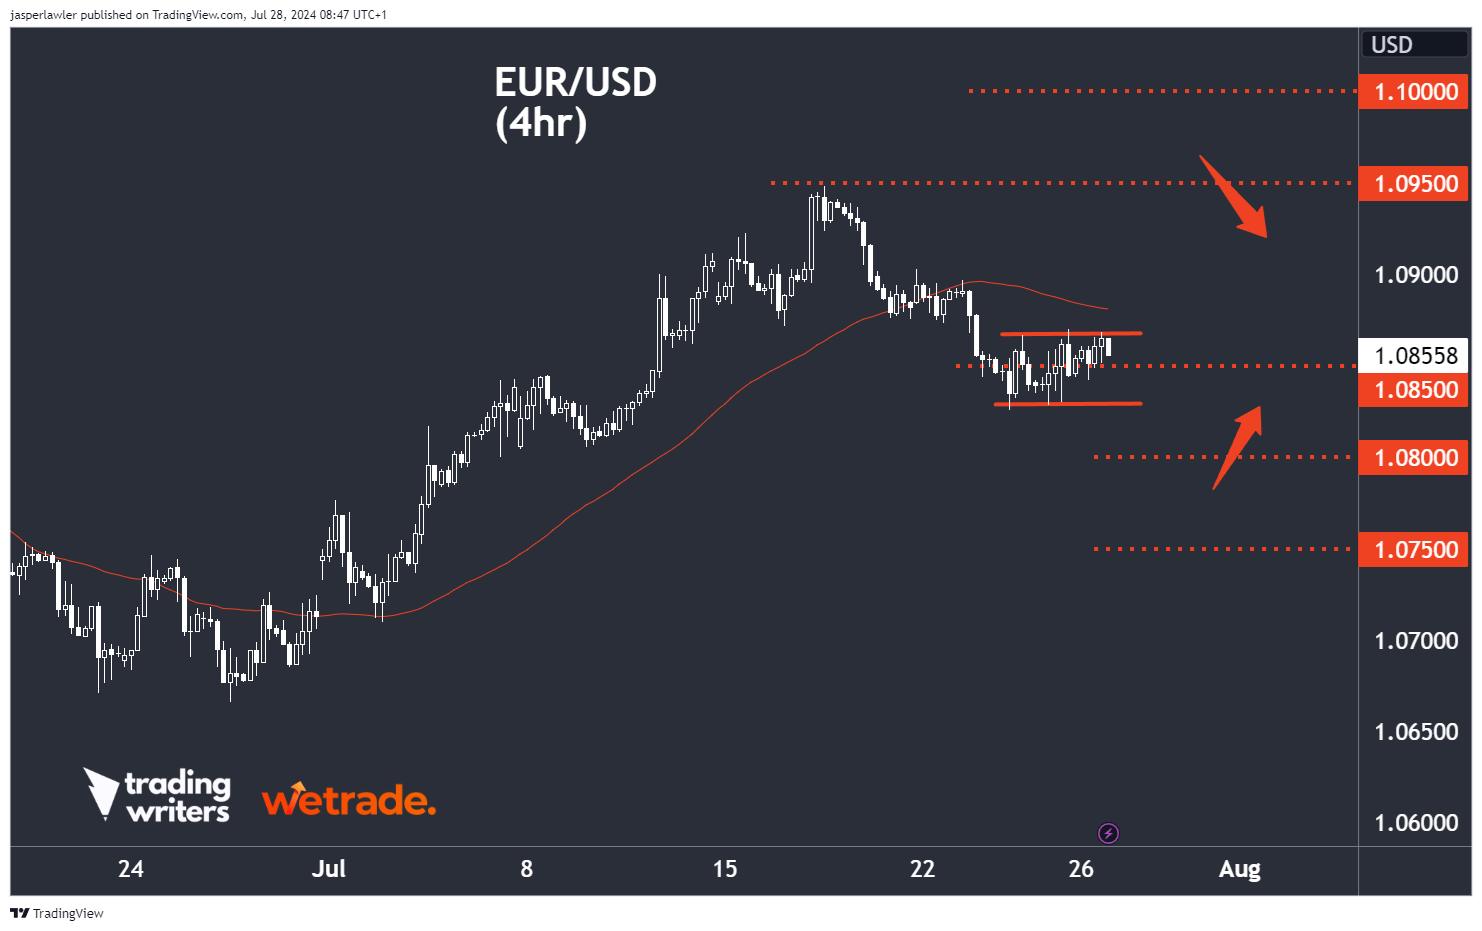
On the 4-hour chart, you can see how the price topped at 1.095 and pulled back 100 pips to 1.085 and now the price is stuck in a box. A break down from the box and then below 1.08 would set up potential long trades, while a break higher would nullify the opportunity for now.
Gold (XAU/USD)
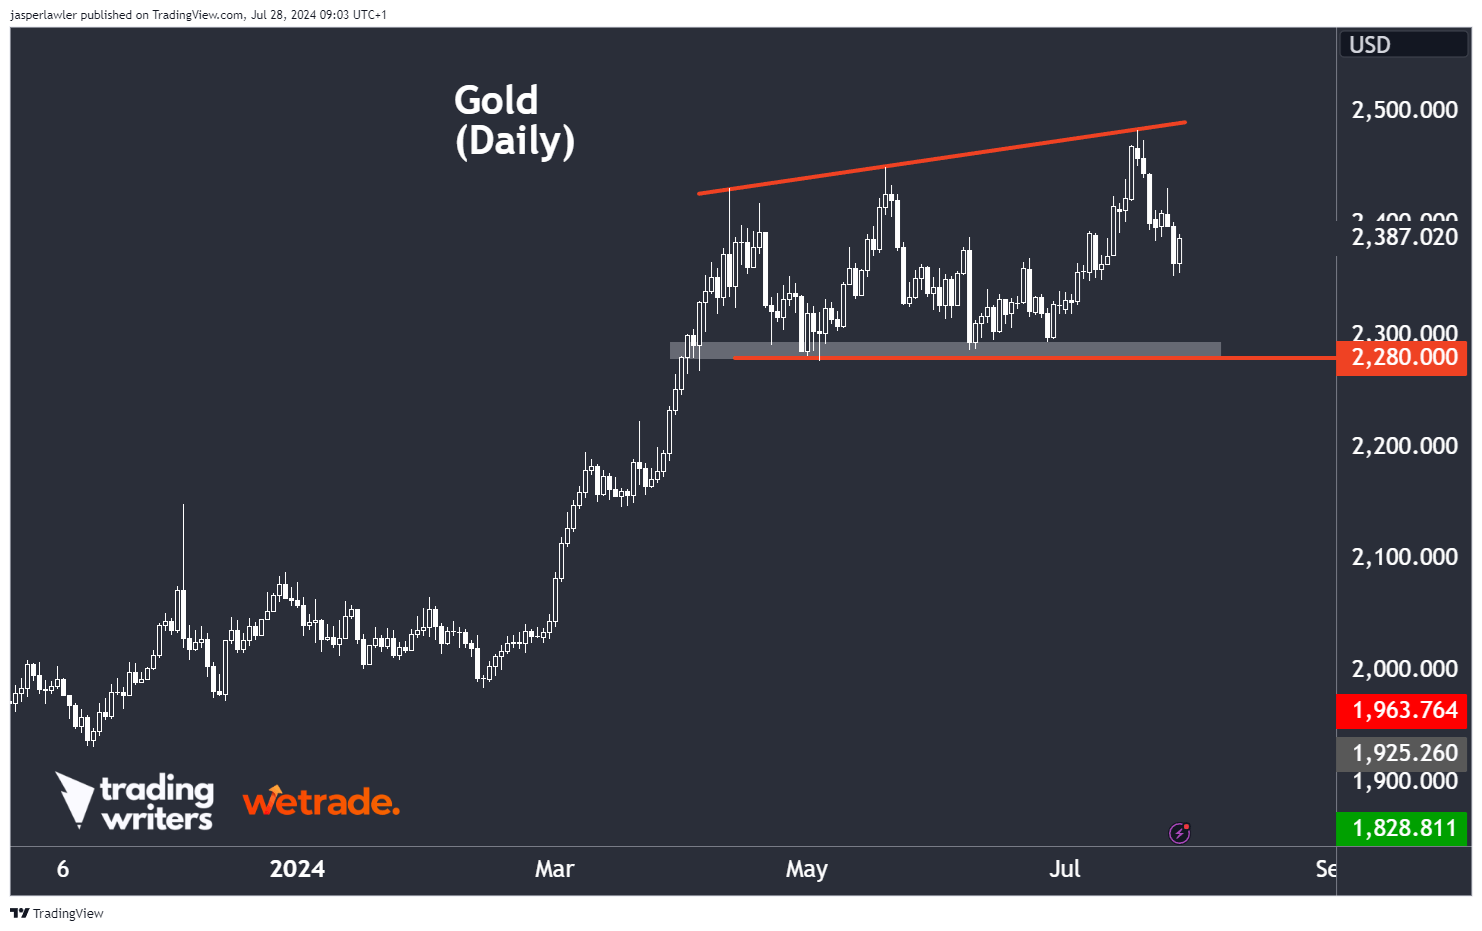
It’s been a rough week for gold. After setting a new ATH (all time high) the price has pulled back again for a 2nd failed breakout as characterised by a rising trendline connecting the last 3 peaks.
As a reminder - a breakout is a sign of trend strength - a failed breakout is a sign the trend is weakening.
Gold is still in a long term uptrend while above major support at 2,280.
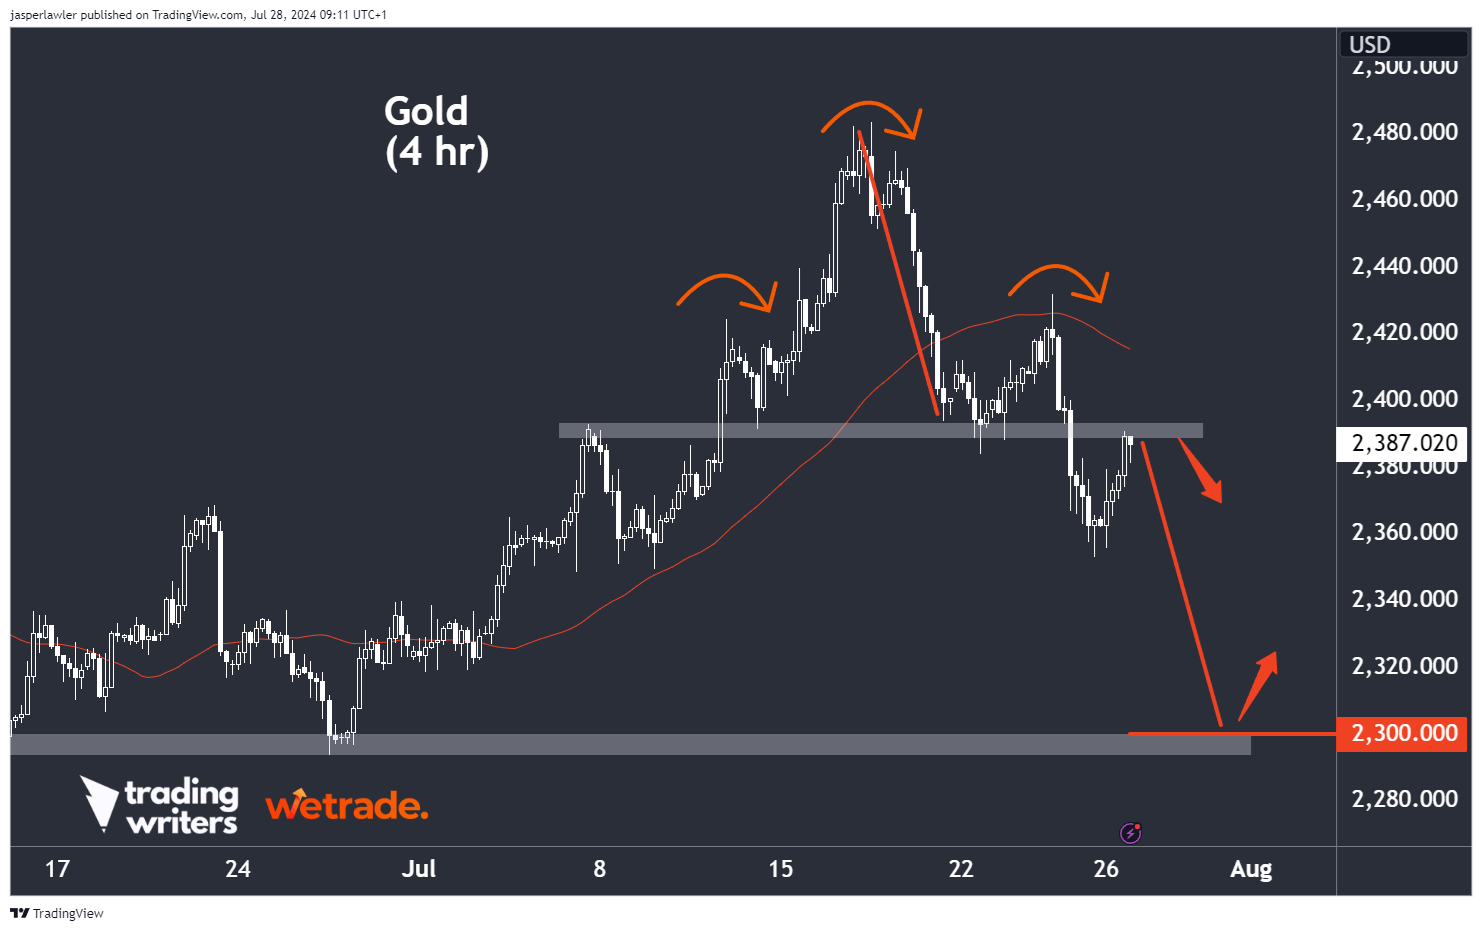
Dropping down to the 4-hour timeframe - a head and shoulders top pattern would indicate the price has further to go lower.
Taking the height of the pattern to its ‘neckline’ shown in grey (around 2390)- and projecting it from the bottom of the neckline lower shows a downside objective that matches the long term support around 2280-2300.
Hope this helps and thanks for reading!
Trade with WeTrade!
Every position closed is one step closer to unlocking WeTrade Honours privileges and redeeming exclusive rewards.
Start your trading journey here - Register now
Kickstart your trading of the week here - Login Now
Jasper and the team at Trading Writers in collaboration with WeTrade.


