(EUR/USD | USD/CAD | Bitcoin)
Quite often life doesn’t happen the way textbooks say it should. And that’s especially true in markets.
One of the first and most important things you learn as a trader is support and resistance levels. You buy above support and sell if support gets broken. Vice versa for resistance.
While this axiom holds broadly true, there are some very tradable exceptions, which generally come in the form of ‘fakeouts’.
EUR/USD
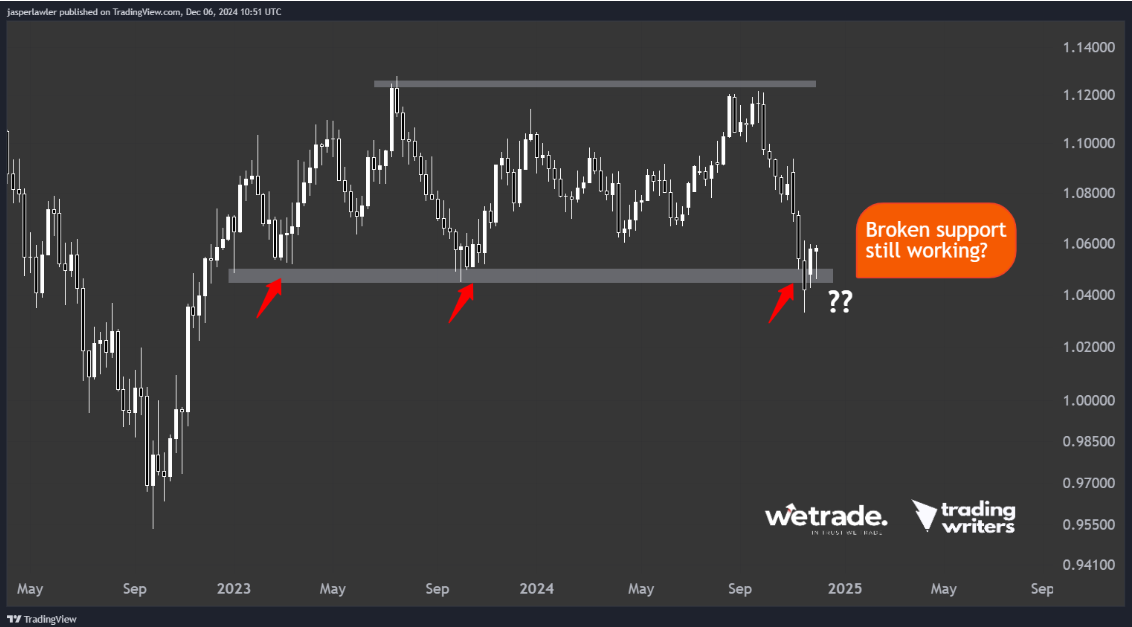
The situation in EUR/USD could probably be better described as a ‘bear trap’.
Long term support around 1.05 got taken out this month, only for short sellers to get squeezed and for the price to return back over the support level.
So now what?
The support could certainly still break, but we think the higher probability trade is a further squeeze higher after the false break lower (bear trap).
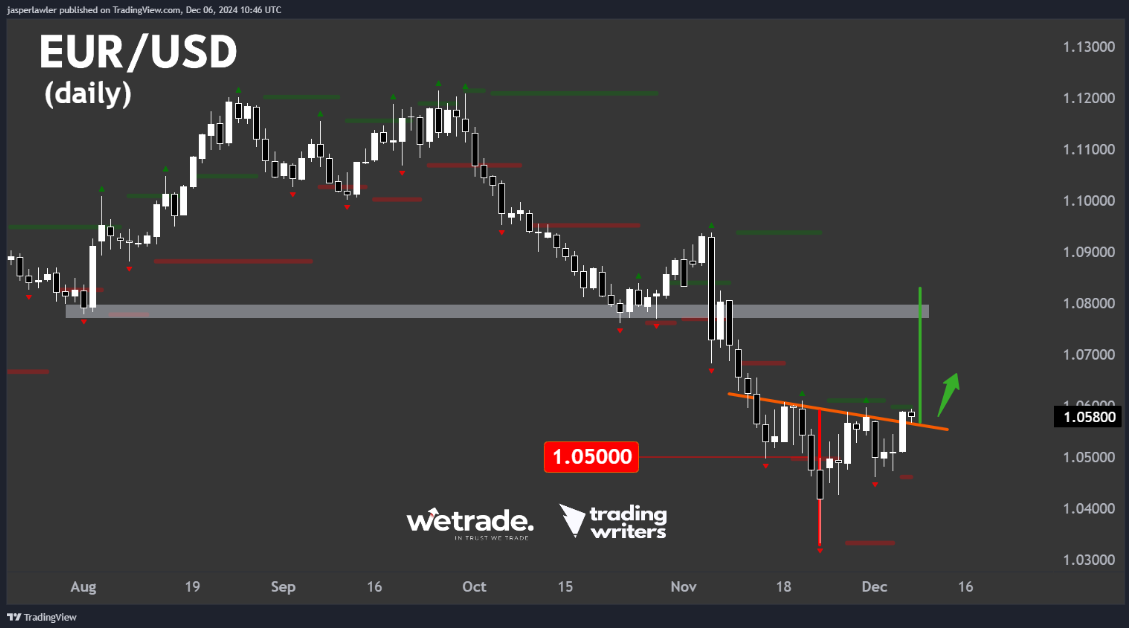
For a bit of added confirmation, the daily chart appears to show an inverse head and shoulders price pattern
Using the height of the pattern we can ascertain a price objective north of 1.08, which would take the price back for a retest of the same level as former support / potential resistance.
A close back under 1.05 would suggest the bear trap has run its course sooner than expected and the trade is off.
USD/CAD
If you are still bullish on the US dollar, perhaps one of the better places to look is USD/CAD.
It’s also a ‘Trump trade’ because of the possibility of tariffs or tougher trade terms between the US and Canada under President-elect Donald Trump.
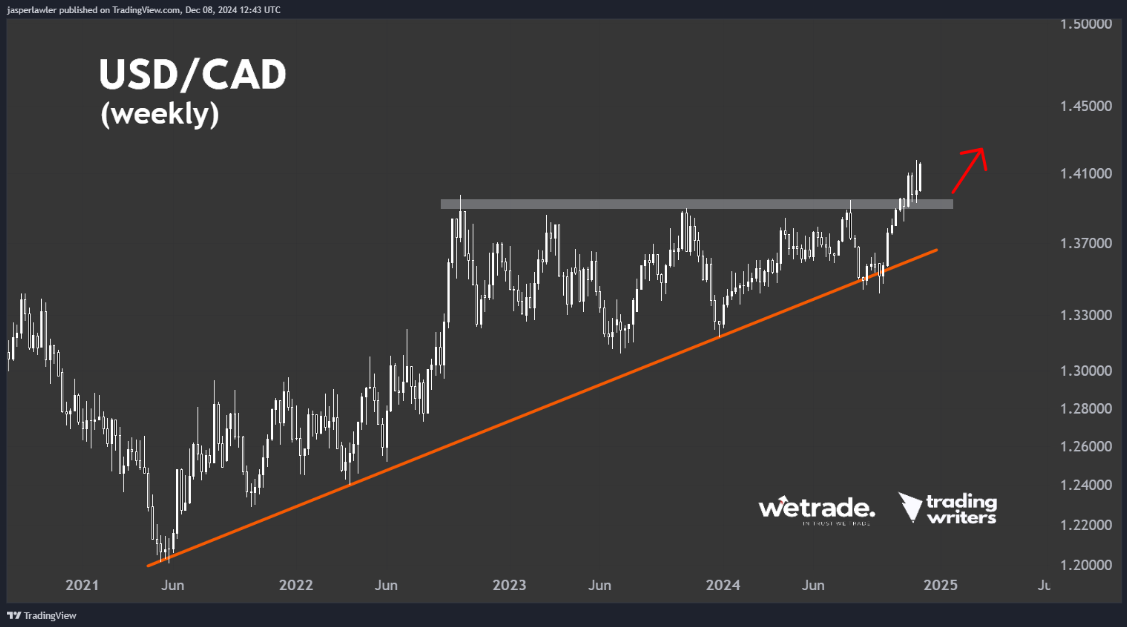
We first pointed out this long term breakout trade back in our analysis for Week 46. Back then the price of USD/CAD was 1.39 - and 250 pips later - the breakout has been confirmed again.
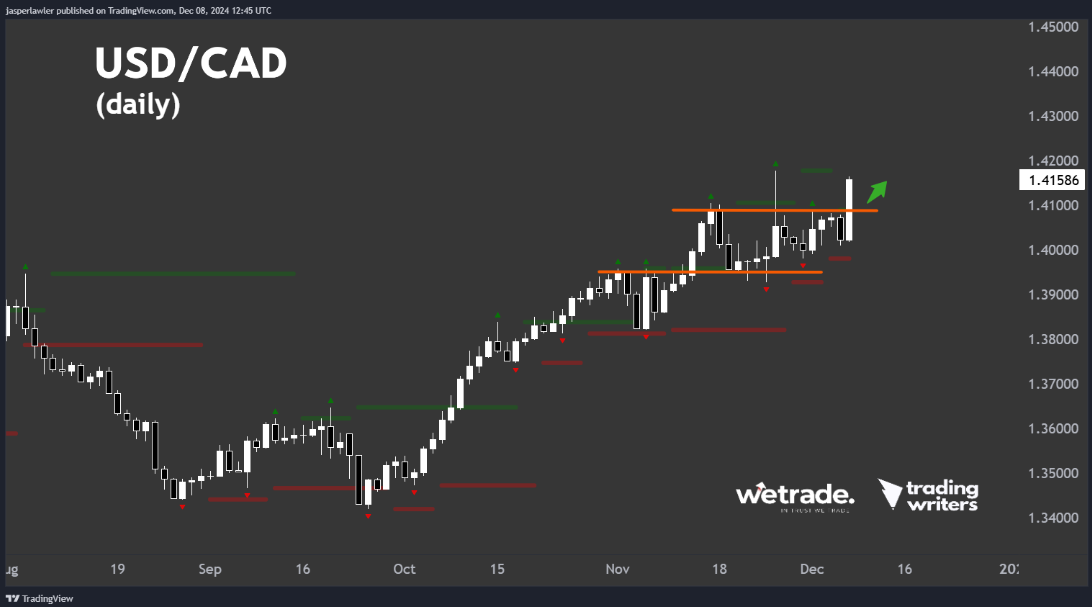
The breakout happened nearly straight away after we published in week 46 but the price then consolidated in a 100-pip range - excluding one false breakout - for a whole month.
Former resistance at 1.409 is now support to the latest breakout but given the importance of this level on the weekly chart - we’d be surprised to see the price pullback that far.
Now that 1.40 and the 1-year old resistance level has been cleared, we think there’s a good chance the price moves rapidly up towards the next round number of 1.45.
Bitcoin (BTC/USD)
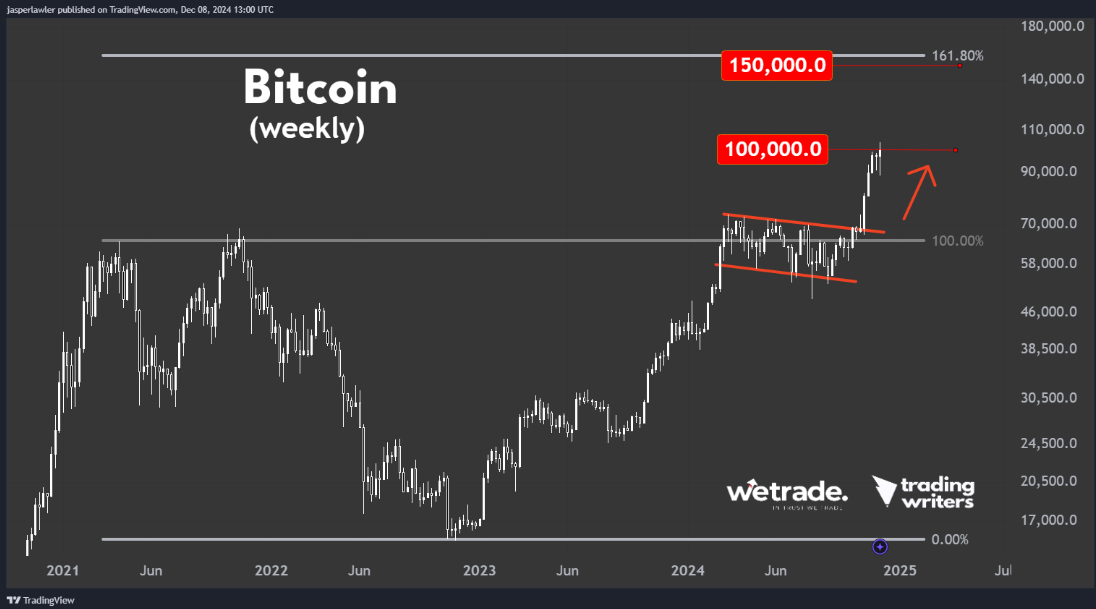
So Bitcoin has reached the huge $100,000 milestone. Time to sell your entire digital wallet?
Hold on a moment.
Using a Fibonacci extension of the entire 2021-2023 bear market, 161.8% - the next major target over the 100% level is above $150,000..
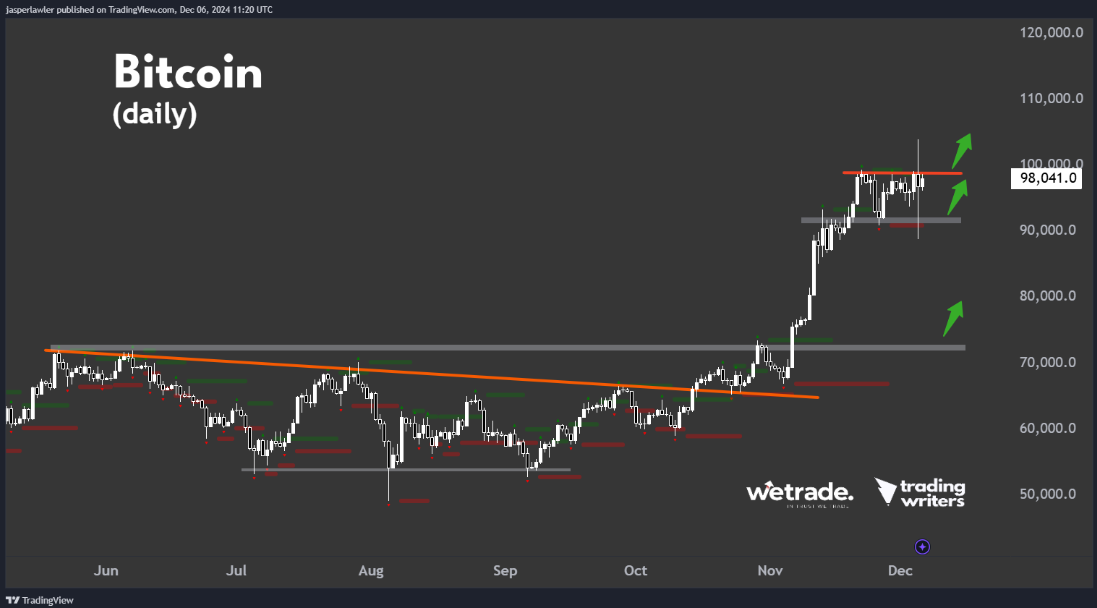
Looking at the daily chart, you can better see the consolidation that’s taking place around the key round number (100k).
Our bias remains bullish but timing an entry for the moment is tricky given the high levels of volatility. Stop losses and risk management are crucial here.
The first possible entry is a breakout into record highs, the second is a pullback to the bottom of the range over $90,000 - and the third would be a drop all the way back to long term resistance turned support at $70,000.
But that’s just how the team and I are seeing things, what do you think?
Send us a message and let us know how you plan to trade these markets.
Trade with WeTrade!
Every position closed is one step closer to unlocking WeTrade Honours privileges and redeeming exclusive rewards.
Start your trading journey here - Register now
Kickstart your trading of the week here - Login Now
Produced by Jasper and the Trading Writers team in collaboration with WeTrade.


