This might sound a bit obvious…
When stocks are in a bull market we like to buy stocks!
The S&P 500 index just recorded its second back-to-back yearly performance of over 20%. That hasn’t happened in over 25 years. 2024 also marked the fourth year of 20%+ gains in the past six years for the S&P 500.
Clearly it's a raging bull market.
But on the other hand, stocks can’t print 20%+ gains every year - that would be too easy!
This is one of the finer points of trend trading. You should keep following the trend but always be on the lookout for signs it might end.
S&P 500 (SPX/USD)
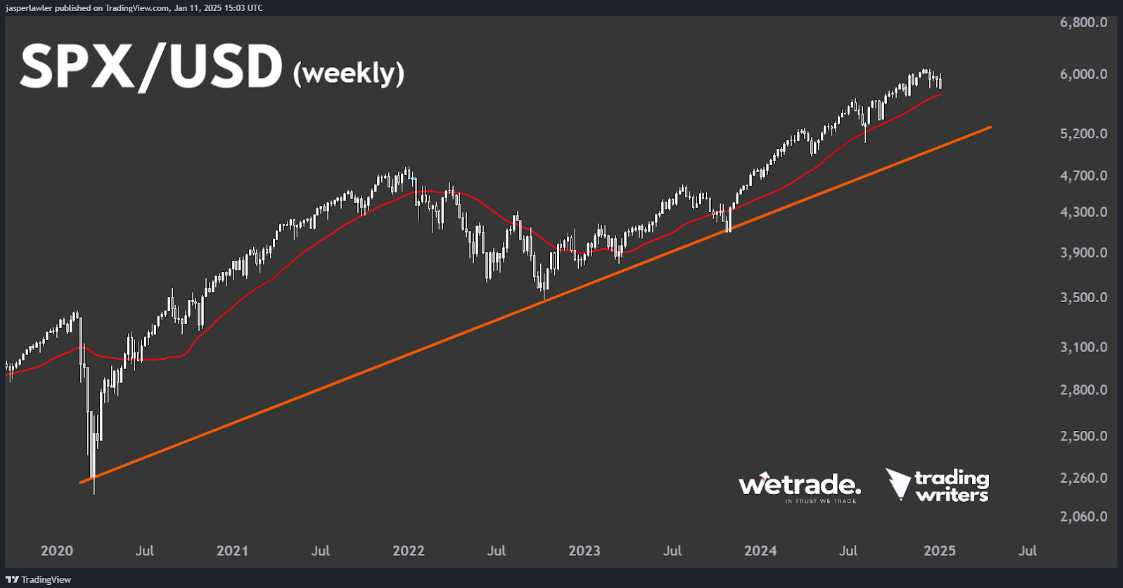
Looking at this weekly chart going back as far as the pandemic era lows in 2020, the bull market is clear to see.
The price is still above the 30-week moving average and well above the long term rising trendline. We will remain bullish while price holds above the 30-week SMA.
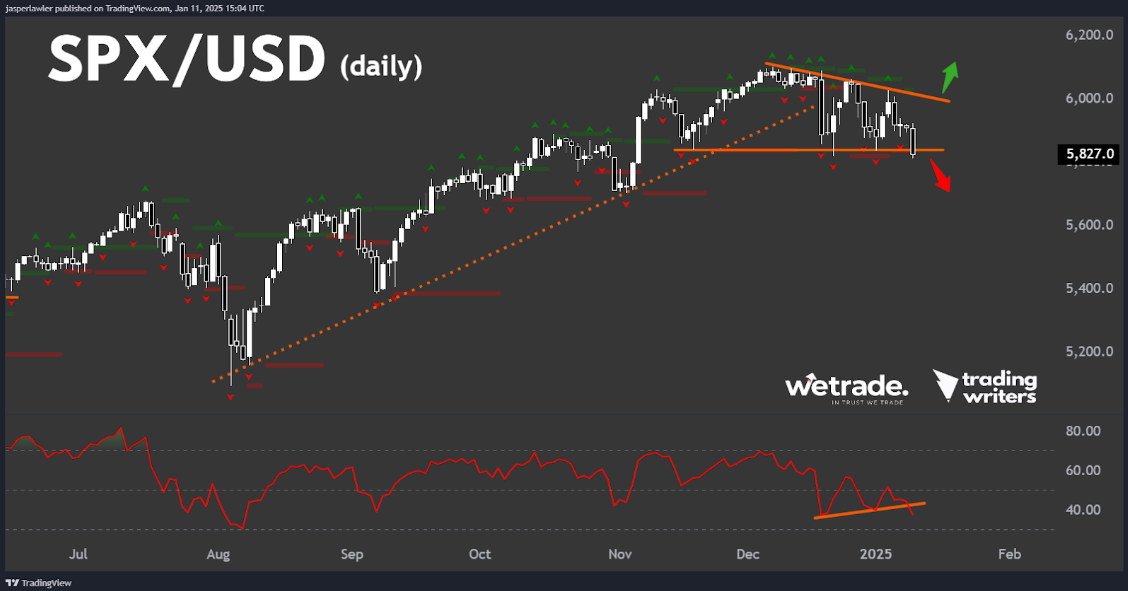
Down on the daily chart, it’s a different story.
Price is breaking down from a triangle pattern after having already broken its rising trendline that connects the lows going back to August.
This is a bearish setup BUT of course it could end up being a false break and setup the next leg higher.
While the price is below the triangle pattern, we will be flat with no positions. Should the price break out of the triangle to the top side, this will be our cue to jump back in to ride the long term uptrend further up.
More aggressive traders could go short, but the weekly chart tells us this is a risky proposition until confirmed with a drop under the 30-week SMA.
USD/CNH
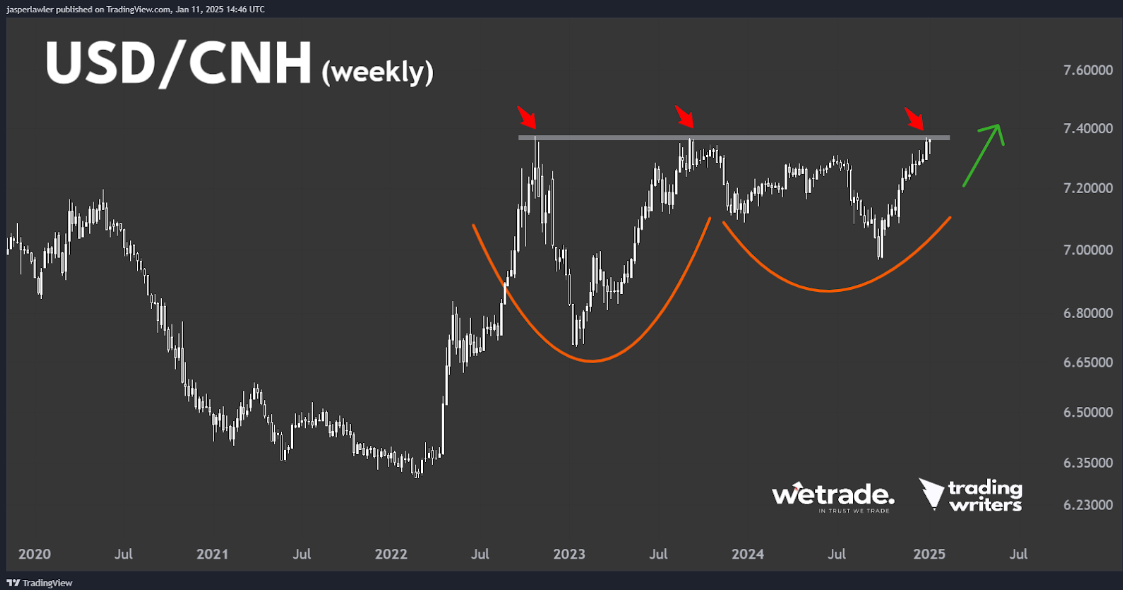
The dollar is testing multi-year highs against the offshore Chinese yuan.
To us this looks like a bullish cup and handle pattern on USD/CNH.
For now there has been no breakout so we will sit and wait to see which way this one goes - another rejection at 7.4 could set up another big drop where as a breakout could open up a monster rally in this pair with no resistance in sight.
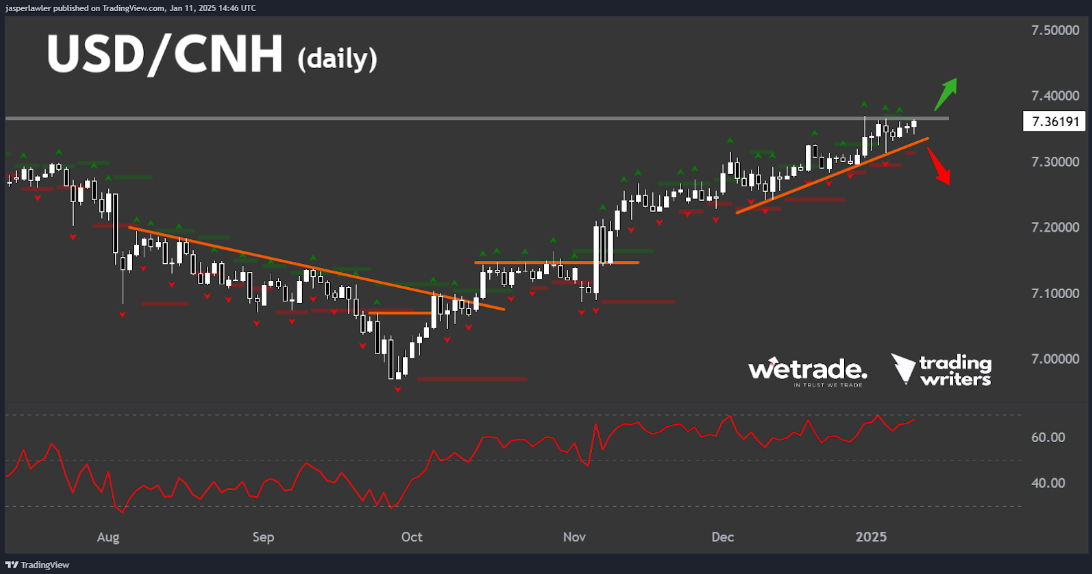
On the daily chart we can see our trigger areas better.
A breakout over long term resistance is the cue to go long, while a break below the rising trendline is the cue to go short.
GBP/USD
It’s noteworthy that 30-year gilt yields (British government bonds) hit their highest since 1998 last week.
Higher UK yields should be a positive for GBP but US Treasury yields are rising at a faster pace - so on a relative basis, GBP is less attractive to USD.
Additionally, rising yields are only positive if they reflect rising confidence in a booming economy, but this time investors seem to be dumping UK bonds as they lose confidence in the new British government’s fiscal policies.
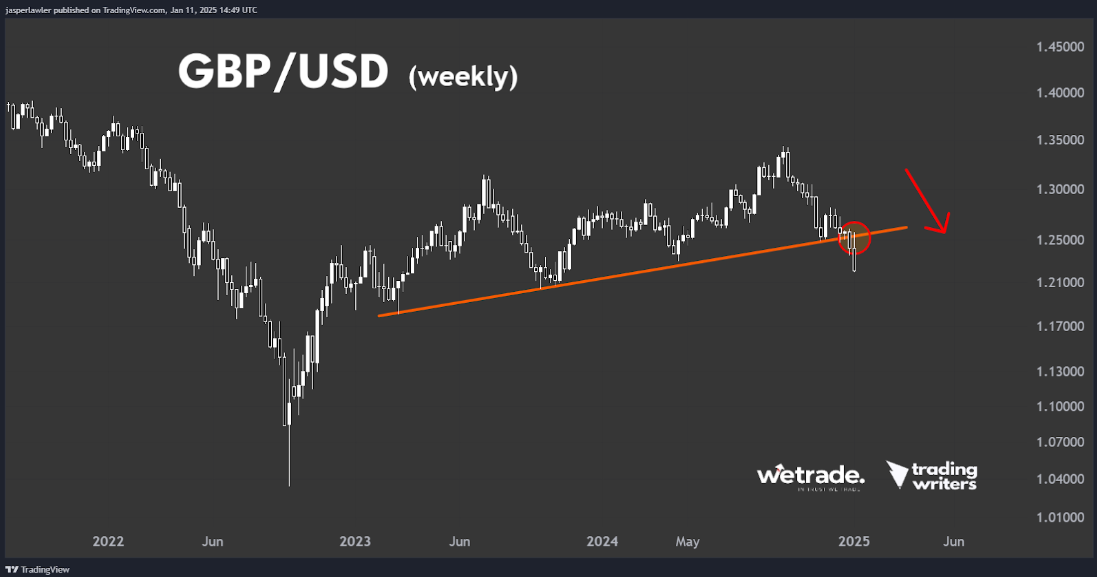
On the GBP/USD weekly chart we see all this via a breakdown from the long term rising trend line.
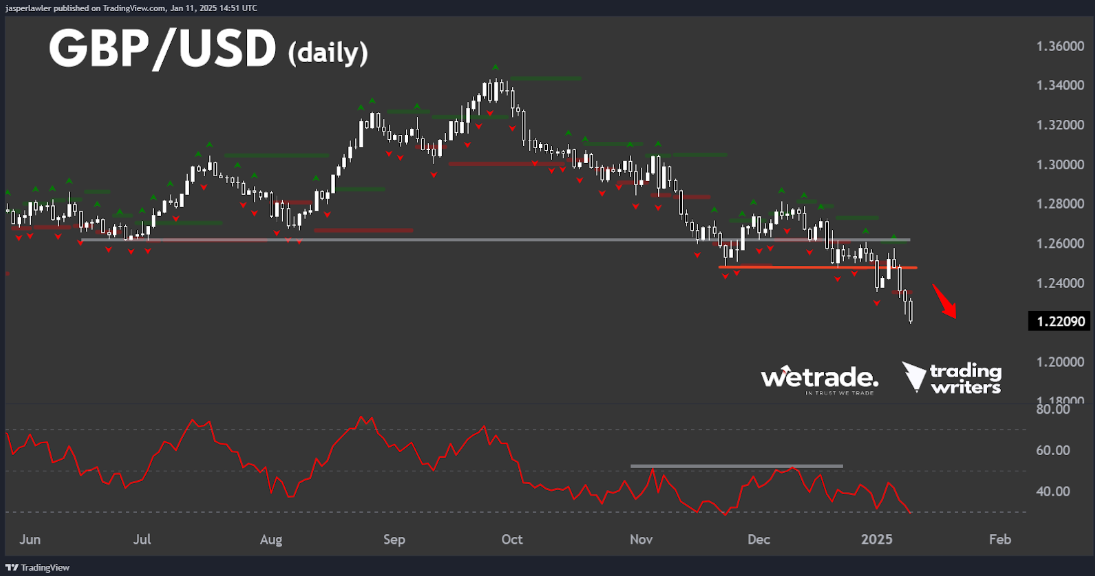
Down on the daily chart, the downtrend has been going on a while. We are still bearish but should lower our expectations about how much further the market can drop in the short term without a bigger bounce.
1.2500 is our dividing line between entering new short positions, with 1.2000 as a natural short term target to the downside.
But - as always - that’s just how the team and I are seeing things, what do you think?
Share your ideas with us - OR - send us a request!
Trade with WeTrade!
Every position closed is one step closer to unlocking WeTrade Honours privileges and redeeming exclusive rewards.
Start your trading journey here - Register now
Kickstart your trading of the week here - Login Now
Produced by Jasper and the Trading Writers team in collaboration with WeTrade


