There was a big fast move in EUR/USD last week.
The ‘European currencies’ did especially well versus the US dollar, including GBP/USD and USD/CHF as well as the ‘Skandies’ SEK/USD and NOK/USD.
If you rode the move, then job done. If you did ride the move up, you might have taken full profits already - or maybe you are leaving a little bit of the position open to ride any continuation of the move.
But, what to do if you missed it completely?
Explosive moves in the market usually mean traders who were on the ‘losing’ side step out for a while, having lost confidence in their view. For example if you were bearish and the market makes a significant move higher - you’re probably going to be a lot less confident in your bearish view - but perhaps also not ready to take an opposite bullish view. The loss of sellers in the market can see the up-move continue with minimal pullback.
This might suggest buying any small dips to ride the next leg higher, and emotionally it would offer some salvation to capture the second leg of the move even if you missed the first leg. However, what you are doing here is ‘chasing the market’.
One trouble is that after a big move in the market, there is no definitive place to put your stop loss, except at the beginning of the move - which is now far away. That's a bad risk: reward.
It is tempting to place a closer (more manageable) stop loss under lower timeframe levels of support - but then you find yourself trading an unknown strategy that requires different rules to follow because it is based on a lower timeframe.
And indeed, after a sharp move in the market - there is still a chance for a sharp pullback to match. Why? Because buyers quickly take profits on their unexpected quick gains, which will create selling pressure into minimal support - because the next support level is far away.
A sharp pullback would mean an opportunity to buy into the uptrend at a lower level, closer to the previous support. But then the flipside of the sharp pullback is that it raises questions over the sustainability of the initial move.
Probably the biggest takeaway here is not to think about this ‘explosive’ move in isolation.
Instead of forcing a trade, consider:
- Waiting for the right setup in the same market. If your strategy is based on structured breakouts, wait for the next clean consolidation or pattern before re-engaging. A big move often leads to a new setup—but forcing a trade in the middle of a volatile move isn’t a strategy, it’s FOMO.
- Looking at uncorrelated markets. Just because EUR/USD already made a big move doesn’t mean you have to trade it now. If you want to be in at the start of a move, shift focus to another market that hasn’t yet made its move.
- Sticking to your edge. If your strategy works over hundreds of trades, don’t abandon it just because one market moved without you. The next opportunity will come—if not in this market, then in another.
Again, the best trades don’t come from reacting to what already happened, but from positioning for what’s about to happen. If you missed the move, accept it, reset, and wait for the next high-quality setup—whether in the same market or somewhere else.
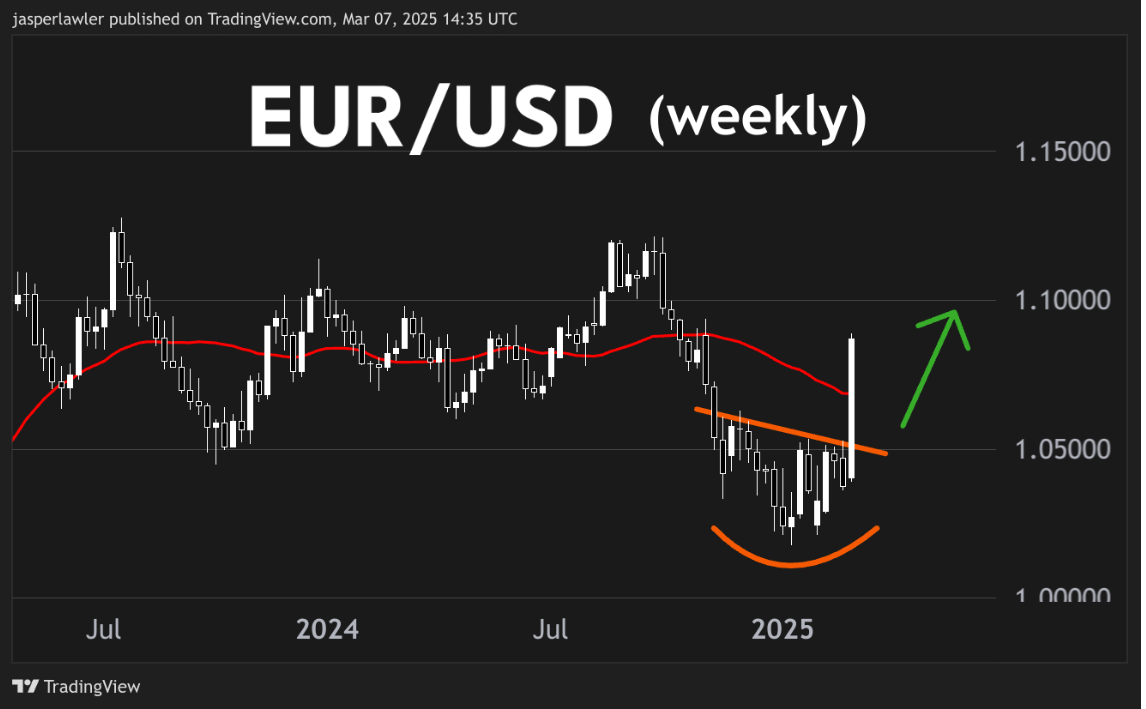
EUR/USD
Long term chart (weekly)
Trend: Up
Phase: Bullish reversal (bottom)
Resistance = 1.10 (round number)
Support = 1.07 (30 week MA)
Price action: A huge bullish breakout of the falling trendline. The move back over the 30-week MA suggests the prior downtrend has reversed.
View: We have turned cautiously bullish and will look for the price to establish itself above the 30-week MA in a new uptrend. A drop back under the 30-week MA would imply range bound conditions.
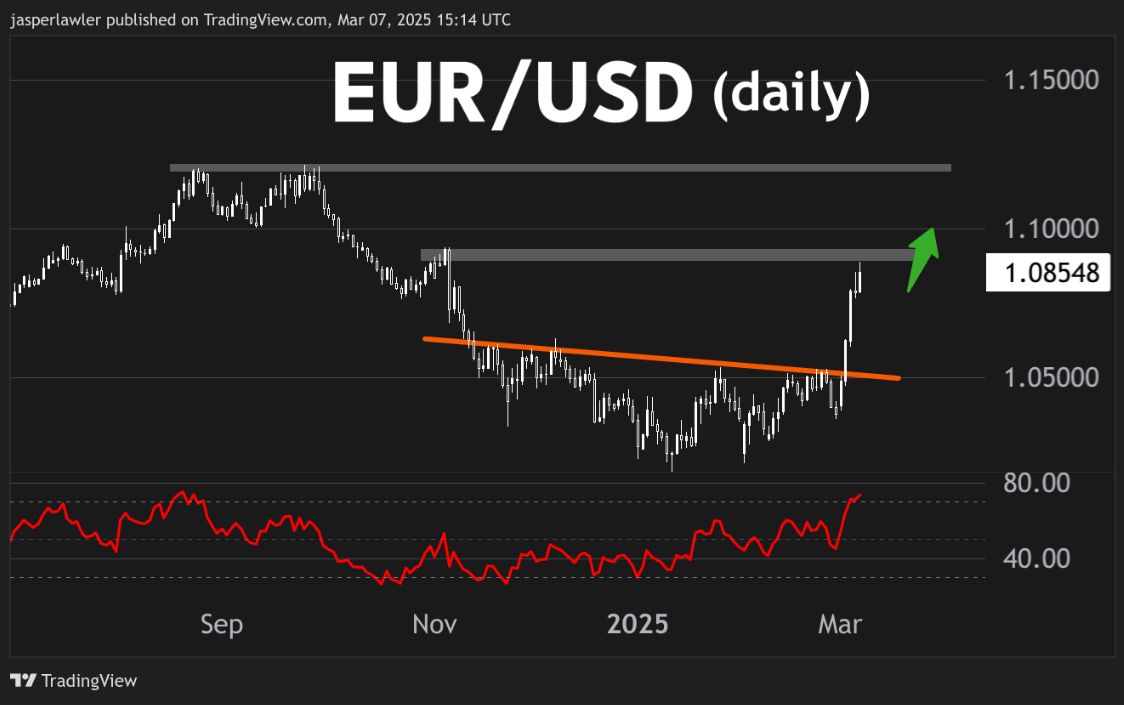
Medium term chart (daily)
Trend: Up
Phase: First move of new uptrend
Resistance = 1.0930 (old high)
Support = 1.05 (broken trendline)
Price action: The volatile move higher could continue short term but nearby resistance and an overbought RSI could lead to a consolidation. Our bias is bullish until a short term topping pattern.
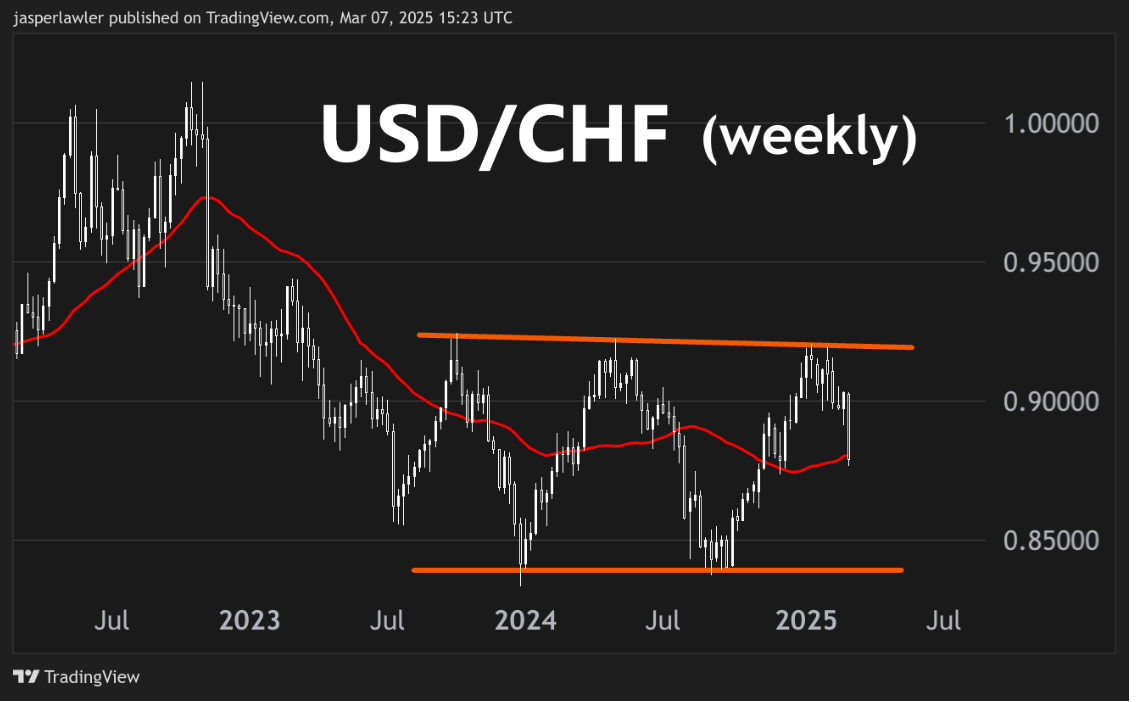
USD/CHF
Long term chart (weekly)
Trend: Sideways
Phase: middle of the range
Resistance = 0.92 (range top)
Support = 0.84 (range bottom)
Price action: The high probability sell opportunity from the top of the range has concluded.
View: We will look for new sells back over 0.90 or wait for a further drop toward the range bottom to look for longs.
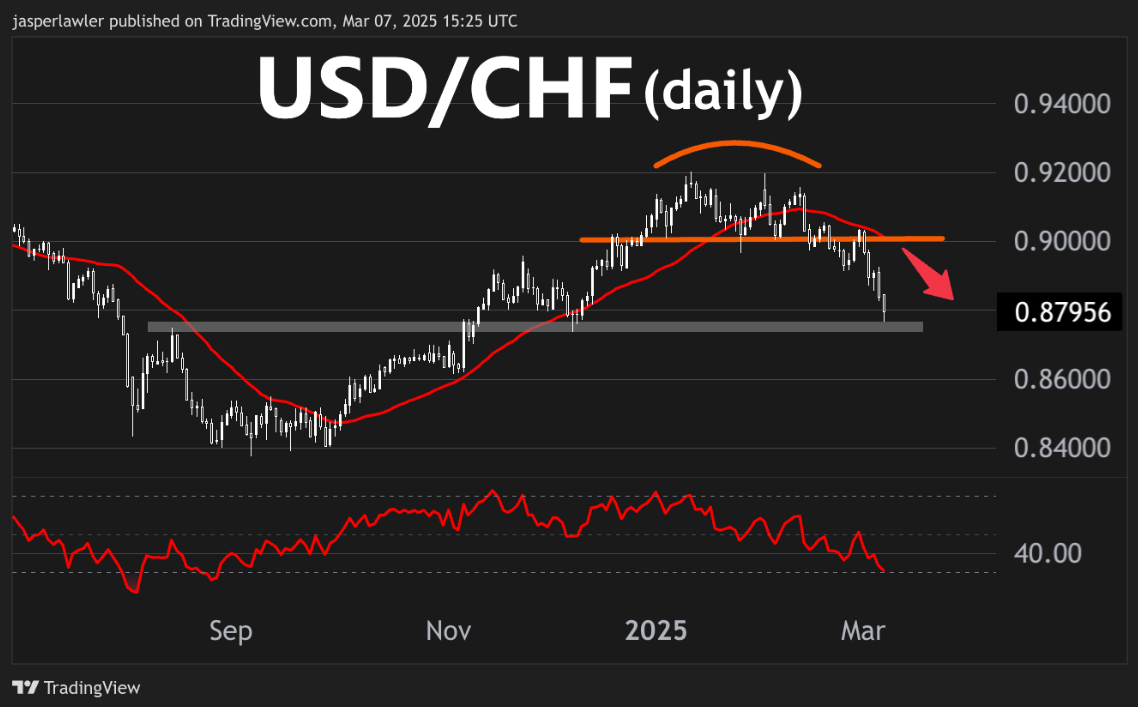
Medium term chart (daily)
Trend: Down
Resistance = 0.90 (Neckline)
Support = 0.878 (former high/low)
Price action: The double top pattern has reached its objective.
Plan: We will look for rebounds off nearby support to offer new sell opportunities.
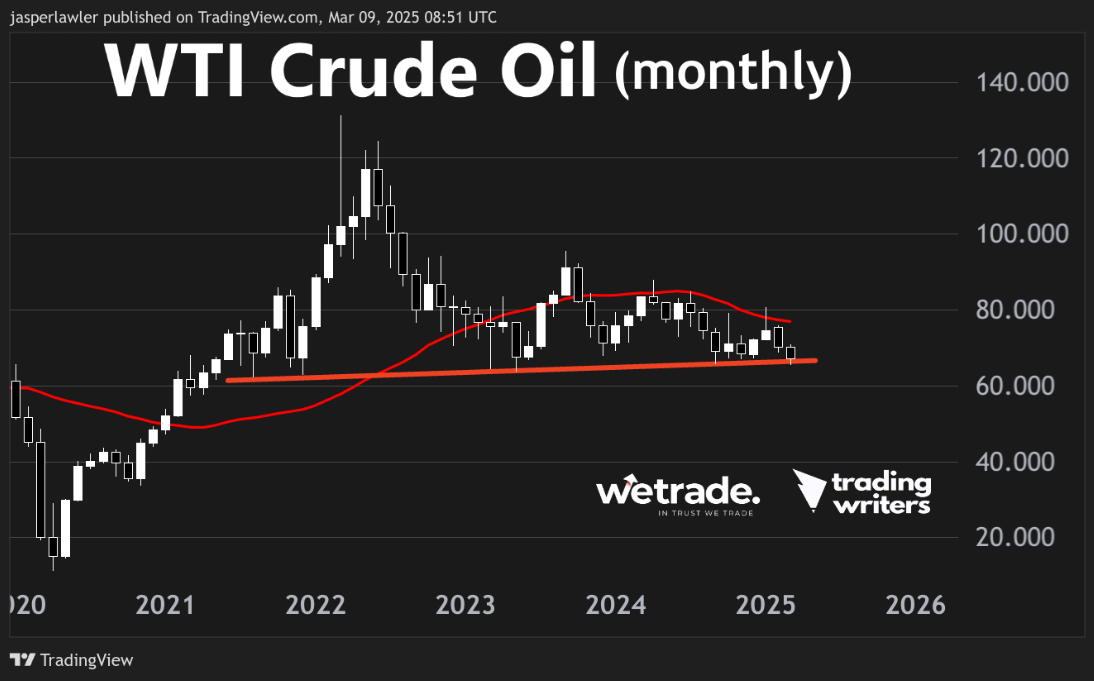
US Oil (USO/USD)
Long term chart (monthly)
Trend: Sideways
Resistance = $78 (30-month MA)
Support = $65 (multi-year uptrend line)
Price action: The price has been rejected on the last 3x attempts to break over the 30-MMA with successive lower highs.
Plan: We are looking to get bearish on the break of long term support.
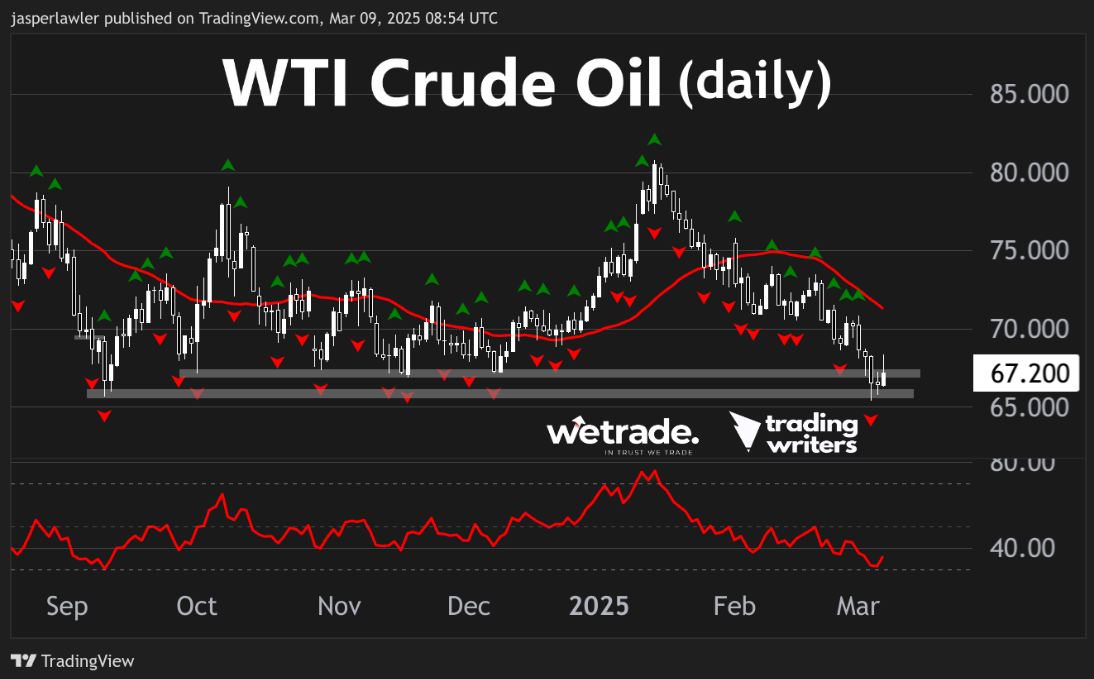
Medium term chart (daily)
Trend: Down
Phase: Continuation
Resistance = $72 (30 DMA and former support)
Support = $65 (range bottom)
Price action: It has been a long downtrend from a failed move at the top of the range down to the bottom of the range.
Plan: With RSI oversold, look for chances to get long above long term support.
But - as always - that’s just how the team and I are seeing things, what do you think?
Share your ideas with us - OR - send us a request!
Send us an email or message us on social media.
Cheers!
Trade with WeTrade!
Every position closed is one step closer to unlocking WeTrade Honours privileges and redeeming exclusive rewards.
Start your trading journey here - Register now
Kickstart your trading of the week here - Login Now