There is a correction taking place in the US dollar uptrend. Do we trade against the prevailing trend, or sit on our hands and do nothing?
To fade or not to trade, that is the question.
When a strong trend has been in place for around 3 months - sometimes sooner - sometimes later (we have observed 3 months as a good benchmark) something tends to change - either there is a significant correction or the trend reverses.
The challenge lies in distinguishing between the two. Reacting too early risks fighting momentum, while reacting too late means missing an opportunity.
Our view is - instead of predicting, let the market reveal its hand. The goal is not to guess but to follow a structured trading system that tilts the odds in our favor.
A Structured Approach
1. Identify the Primary Trend
Use the 30-week moving average (30 WMA) as the trend filter.
- Uptrend: Price is consistently above the 30 WMA, and the slope is rising.
- Downtrend: Price is consistently below the 30 WMA, and the slope is falling.
A strong trend remains in place as long as price respects the 30 WMA. A violation suggests a shift is possible.
2. Look for Fractal Confirmation of a Shift
- In an uptrend, a higher low followed by a higher high confirms continuation.
A break of the previous higher low suggests possible trend weakness.
- In a downtrend, a lower high followed by a lower low confirms continuation.
A break of the previous lower high suggests possible trend weakness.
* The key fractal to watch is the first lower high after an uptrend correction that made a lower low (potential top) or the first higher low after a downtrend correction that made a higher high (potential bottom).
The best way to demonstrate this system is with some examples...
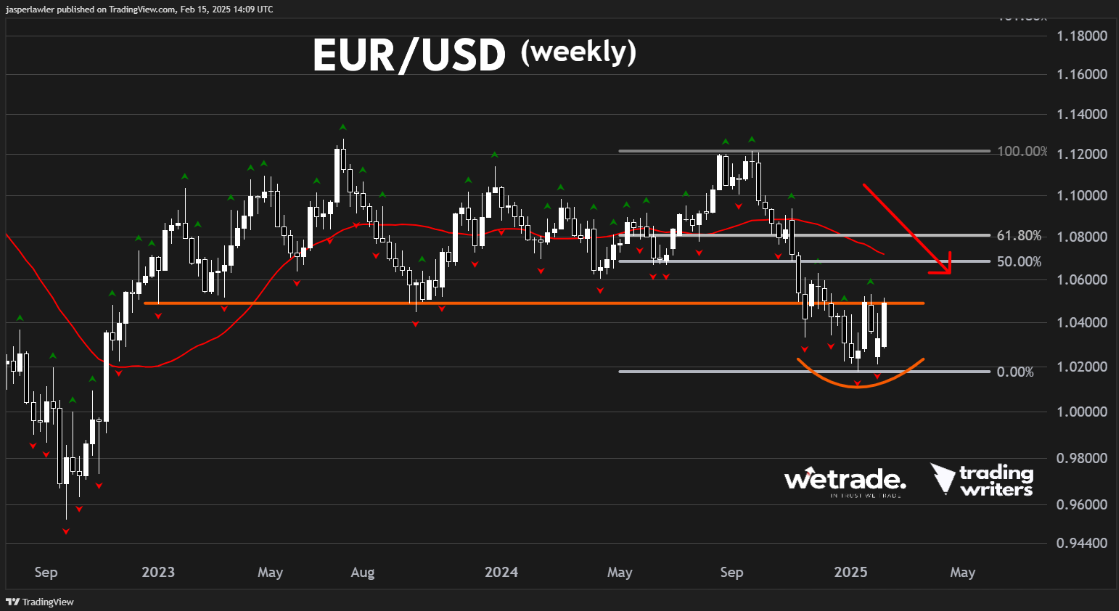
EUR/USD
The weekly chart shows a base has formed at 1.02 in EUR/USD.
Price closed last week right at support-turned-resistance around 1.05.
As per our rules above, a ‘higher high’ was formed followed by a ‘higher low’ as demonstrated by the green and red fractals accordingly. So a bigger correction seems likely.
However, the price remains below the 30-week moving average.
We can see the setup better on the daily chart as a shallow downtrend line.
The pattern beneath the trendline is a messy inverse head and shoulders. As such, should the trendline break to the upside it is a bullish signal. And if the trendline holds, it signals the trend is still just consolidating before a continuation lower.

We think there’s a good chance this trendline breaks given the alignment of the weekly fractals.
So fade the downtrend or ignore the possible move upwards without a trade?
To answer that it helps to think about the next step. If the price does break higher, how high is it likely to go? There is resistance at 1.06 from the late November and December peaks. Then the 50% Fibonacci retracement and the 30-week moving average come in around 1.07.
The reason fading a trend has a lower probability of success vs trading with the trend is because there is so much nearby resistance (in the case of trading a bottom).
You can absolutely fade this trend but our experience tells us the price often fails at a nearby resistance level, capping the risk:reward potential on long positions- and simultaneously offering a nice opportunity for short positions.
GBP/USD
The setup is similar in GBP/USD - because of the dollar in both majors!
The price is testing the broken uptrend line- and could break above it.
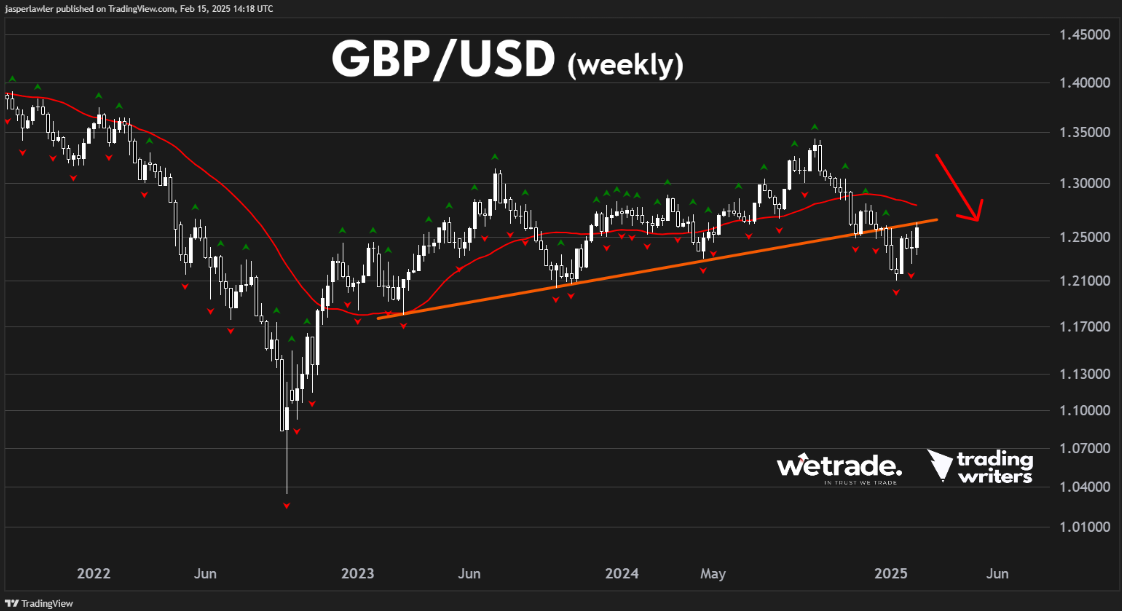
On the daily chart, a downtrend line has already broken and so has critical resistance at 1.25.

Should the breakout follow-through it faces resistance at 1.28 from the December high and 30 week (150 day) moving average.
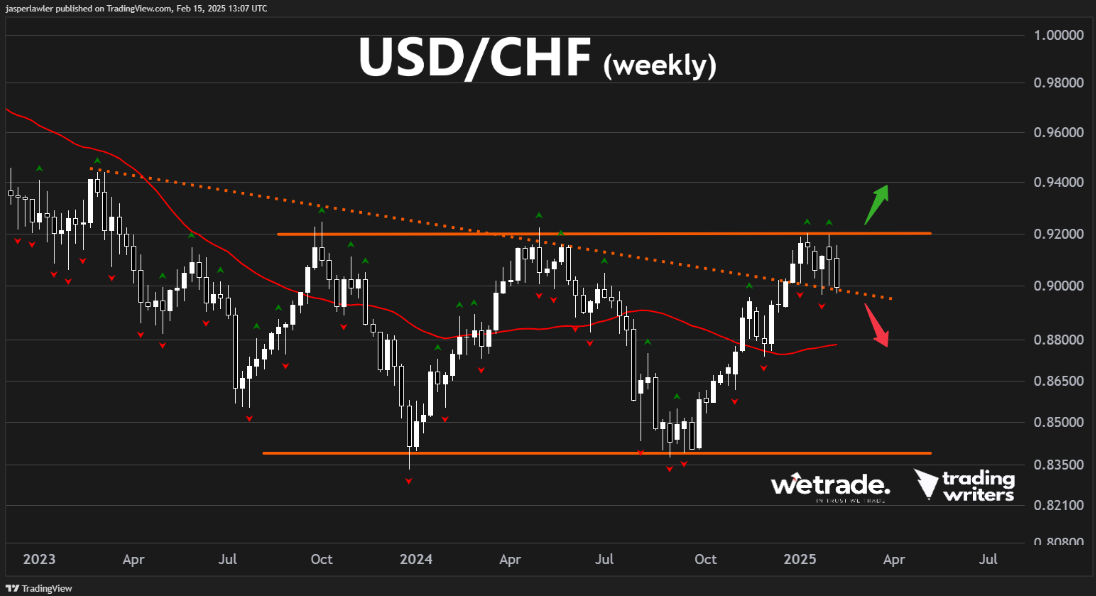
USD/CHF
But do we really face a linear option of fade or no trade?
Actually, it might be a false dichotomy.
Going long EUR/USD and GBP/USD (i.e. selling USD) would mean fading the major trend (as per the weekly charts).
But going short USD/CHF (i.e. also selling USD) would not be a counter trend trade because USD/CHF is in a trading range. Selling below resistance in a trading range is a high probability setup.
We can see the topping process on the daily chart, with 0.90 as the broken neckline.
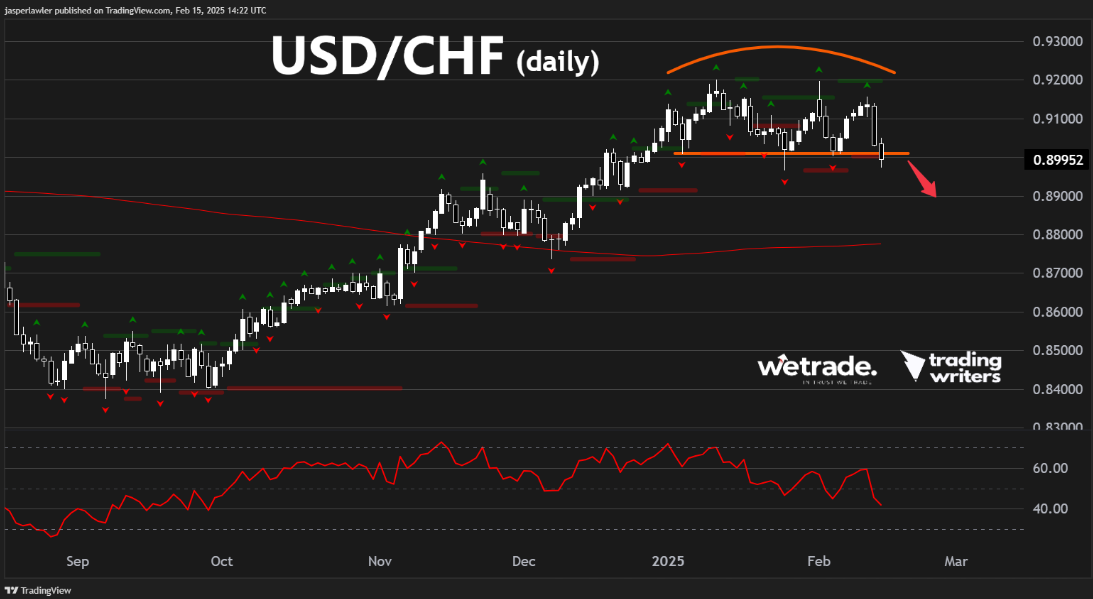
Here the risk is well defined - if the price pops back over 0.90 - the breakdown trade is no longer on but while below 0.90, 0.88 is a natural target as the last major support area and the 30 week moving average.
But - as always - that’s just how the team and I are seeing things, what do you think?
Share your ideas with us - OR - send us a request!
Send us an email or message us on social media.
Trade with WeTrade!
Every position closed is one step closer to unlocking WeTrade Honours privileges and redeeming exclusive rewards.
Start your trading journey here - Register now
Kickstart your trading of the week here - Login Now
Produced by Jasper and the Trading Writers team in collaboration with WeTrade